|
 |
 |
 |
|
|
|
| |
  |
|
| |
 Accuracy
benchmark table Accuracy
benchmark table |
 All
sequences used in the accuracy benchmark, along with the experimental
and calculated data can be downloaded here.
The source of the experimental data available for these sequences
is shown in the table. For an explanation of the consensus
type field ('CON_TYPE')
see the Figure and read the following
section. For more details read the paper: Panjkovich,
A. and Melo, F. (2004). Bioinformatics (in press). All
sequences used in the accuracy benchmark, along with the experimental
and calculated data can be downloaded here.
The source of the experimental data available for these sequences
is shown in the table. For an explanation of the consensus
type field ('CON_TYPE')
see the Figure and read the following
section. For more details read the paper: Panjkovich,
A. and Melo, F. (2004). Bioinformatics (in press).
|
| Distribution
of the available experimental data |
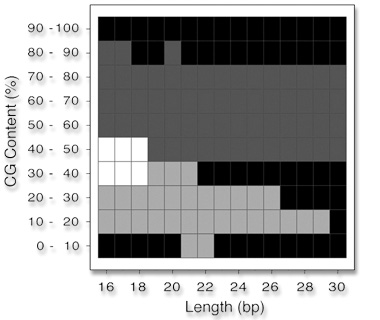
The
total amounts of oligonucleotides with available experimental
Tm values (listed in the table) have been mapped into this
grid according to CG-content and length. The consensus among
two or three methods is defined when at least 80 percent of
the sequences exhibit an absolute difference between the calculated
Tm values of less than 5° C. All pairwise comparisons
were carried out, as well as the simultaneous comparison of
the three thermodynamic methods. Th1
(Breslauer et al., 1986) and Th2
(SantaLucia et al., 1996) did not show similar behaviour
in the whole range of sequence length and percentage of CG-content.
The observed consensus among the methods is as follows: Simultaneously,
Th1 and Th3,
and Th2 and
Th3, exhibit
similar values (white color); only Th1
(Breslauer et al., 1986) and Th3
(Sugimoto et al., 1996) exhibit similar values (light
gray); only Th2
(SantaLucia et al., 1996) and Th3
(Sugimoto et al., 1996) exhibit similar values (dark
gray); and finally, no consensus is observed among any of
the methods (black).
|
|
|
|