|
 |
 |
 |
|
|
|
| |
  |
|
 For
each oligonucleotide sequence, the melting temperatures are
calculated using five different methods and/or parameters. For
each oligonucleotide sequence, the melting temperatures are
calculated using five different methods and/or parameters.
|
 Basic Basic |
Melting
Temperature calculations are based in the following expression
(Marmur and Doty, 1962):
where w,x,y,z are the number of the bases A,T,G,C in the sequence,
respectively.
Assumptions: This equation assumes that the
annealing occurs under standard conditions in a buffered solution
of 50 mM Na+, 50 nM of oligonucleotide concentration and with
a pH near 7.0, though the Tm of DNA is unaffected within a
significant range of pH around 7.0 due to the lack of titratable
groups near this pH in Watson-Crick paired DNA.
|
| Salt
Adjusted |
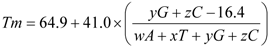
Melting
Temperature calculations are based in the following expression
(Howley et al., 1979):

where w,x,y,z are the number of the bases A,T,G,C in the sequence,
respectively. In this equation, the second term adjusts for
the GC content and the third term adjusts for the length of
the sequence.
Assumptions: This equation also assumes that
the annealing occurs under standard conditions of pH near
7.0 and 50 nM of oligonucleotide concentration.
|
| Nearest-neighbor
thermodynamic |
The melting temperatures are calculated using the nearest-neighbor model and thermodynamic data as previously described (SantaLucia, 1998). The equation that the server uses is as follows:
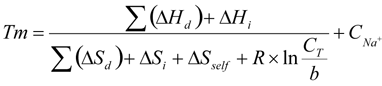
where sums of enthalpy (ΔHd) and entropy (ΔSd) are
calculated over all internal nearest-neighbor doublets, ΔSself
is the entropic penalty for self-complementary sequences, and ΔHi and ΔSi
are the sums of initiation enthalpies and entropies, respectively. R is the gas
constant (fixed at 1.987 cal/K mol), CT is the total strand concentration in molar
units, CNa+ is the salt adjustment factor, and Tm is the melting temperature given in
Kelvin units. Constant b adopts the value of 4 for non-self-complementary sequences
or equal to 1 for duplexes of self-complementary strands or for duplexes when one
of the strands is in significant excess. The Schildkraut-Lifson equation is used
as the salt adjustment factor (Schildkraut and Lifson, 1965), which correspond to 16.6 x Log[Na+].
Three thermodynamic parameter tables are used by this server to calculate the consensus
melting temperature:
Breslauer et al., 1986 (Th1);
SantaLucia, 1998 (Th2)
and Sugimoto et al., 1996 (Th3).
Assumptions:The thermodynamic calculations assume that
the annealing occurs in a buffered solution at pH near 7.0 and that a
two-state transition occurs.
The calculations performed in the consensus Tm estimation method are described in the Figure below.
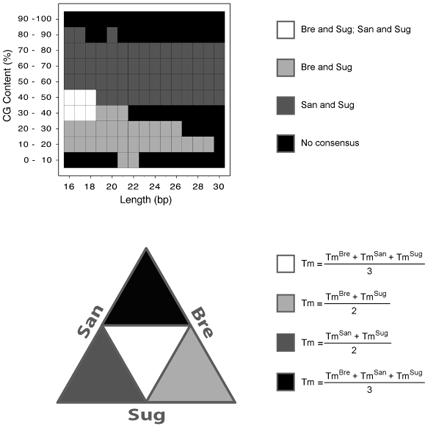
(Top panel) The consensus map from the previous comparative benchmark (Panjkovich and Melo, 2005)
is illustrated. In this benchmark, three thermodynamic data sets were compared: Bre stands for
Breslauer et al. 1986; San stands for SantaLucia et al. 1996; Sug stands for Sugimoto et al. 1996.
In this map, four distinct regions were obtained: 1) simultaneously, Bre and Sug on the one hand,
and San and Sug on the other, exhibited similar Tm values (white colour); 2) only Bre and Sug
exhibited similar Tm values (light gray colour); 3) only San and Sug exhibited similar Tm values
(dark gray colour); and finally, 4) no consensus was observed among any of the methods (black colour).
Bre and San did not show a similar behavior in the complete range of sequence length and percentage
of CG-content. (Bottom panel) A graphical illustration of the different consensus map zones is shown.
Each method is represented as a particular side of an equilateral triangle and the intersection among
methods is shown with the corresponding color of the consensus map. The mathematical expressions used
to calculate the consensus Tm at each zone are also indicated. In the case of San calculations the
most recent thermodynamic parameters (SantaLucia, 1998) are being used by the server to calculate
the consensus melting temperature. This modification respect to our previous study (Melo and Panjkovich, 2005)
has improved even more the accuracy of this server. The Tm estimations of oligonucleotides falling into
the black regions of the consensus map by any of the methods could have a large error. The Tm estimation
error at the other regions where some consensus was observed is expected to be small (below 3-5 ºC).
|
 |
Marmur,J.
and Doty,P. (1962) Determination of the base composition
of deoxyribonucleic acid from its thermal denaturation temperature.
J. Mol. Biol., 5, 109-118.
Howley,P.M.,
Israel,M.F., Law,M.-F. and Martin,M.A. (1979) A rapid
method for detecting and mapping homology between heterologous
DNAs. Evaluation of polyomavirus genomes. J. Biol.
Chem., 254, 4876-4883.
Breslauer,K.J.,
Frank,R., Blöcker,H. and Marky,L.A. (1986) Predicting
DNA duplex stability from the base sequence. Proc.
Natl. Acad. Sci. USA, 83, 3746-3750.
SantaLucia
, Jr. J., Allawi, H.T. and Seneviratne, P.A. (1996) Improved Nearest-Neighbor Parameters for Predicting DNA Duplex Stability.
Biochemistry 35, 3555-3562.
SantaLucia
, Jr. J. (1998) A unified view of polymer, dumbbell, and oligonucleotide DNA nearest-neighbor
thermodynamics.Proc. Natl. Acad. Sci. USA 95, 1460-1465.
Sugimoto,N.,
Nakano,S., Yoneyama,M. and Honda,K. (1996) Improved thermodynamic
parameters and helix initiation factor to predict stability
of DNA duplexes. Nucleic Acids Res., 24, 4501-4505.
Schildkraut, C. and Lifson, S. (1965)
Dependence of the melting temperature of DNA on salt concentration.
Biopolymers 3, 195-208.
Panjkovich, A. and Melo, F. (2005)
Comparison of DNA melting temperature calculation methods for short DNA sequences.
Bioinformatics, in press. (It will appear in Issue 6, March 15, 2005)
|
|
|